
Published boat anchor testing is generally of poor quality. Much of it amounts to nothing better than noise: terrible test designs, absence of controls, lack of repeat trials, and commercial or even nationalist biases generate unhelpful data that confuse and distract. On this page is a collection of those few exceptions that manage to build an accurate and helpful picture of real world anchor performance.
Writers tend not to possess science or engineering backgrounds and lack understanding of what would constitute valid testing, much less reasonable analysis of the resulting data. Even if the publication boasts qualified personnel, testing of an acceptable standard is expensive and unlikely to ever become an activity a magazine will engage in. The three- or four-figure worth of a single article can never bring a financial return on the five- or six-figures of the necessary budget.
Commercial involvement with supposedly independent publications is a particularly insidious example of media failings. An example is a ‘test’ conducted in 2014 by Fortress Marine Anchors in the USA which was covered by a number of well-known publications. Without exception the write-ups included only cursory notes as to the testers’ commercial nature, glossed over as unimportant. Predictably, the results looked exactly as Fortress might prefer them, attending to both the championing of their own product and the disparagement of their most threatening marketplace competitors.
In this case as always the testing methodology may be critiqued, such as a focus on a bottom type in the company’s favor; apples-to-oranges comparisons of aluminium to steel anchors, resulting in mismatched physical sizes; a pulling protocol designed to benefit their product rather than best simulate real world usage; and so on. In a follow-up in PassageMaker, author Nigel Calder debates test ‘witness’ and ex-West Marine corporate man Chuck Hawley, pointing out some of these issues and raising concerns based on discrepancies between the testing data and real world experience – Hawley doggedly maintains that the testing he witnessed was not rigged and that the results were credible. Similar claims were made by Practical Sailor, who took Fortress at their word and simply published supplied results without even bothering to send anyone.
But the problem of any form of bias is very simple, and does not require deep arguments on methodology. In the world of science, where researching the facts of reality with a rigid impartiality is foundational, it is well understood how natural human biases in even the most neutral and competent experimentalist can totally invalidate otherwise carefully planned testing. Peer review will simply not accept results from research which has not taken great care to eliminate bias with basic techniques such as proper controls, randomization, and blind testing.
All this before results are published by the mainstream media. The typical sports magazine staff and writers are unequipped, in terms of qualifications or scientific experience, to review a complicated test. And whether or not the cynical invite from the commercial party to ‘referee’ their testing is accepted, writers are expected to produce a pay-worthy draft that a magazine can dress up as useful to their readers. This alone is sufficient to introduce substantial bias on top of the existing commercial agenda. Such ‘independent’ witnesses, lacking scientific training, are bound to be misled. A clever salesman would rely on it.
The publications involved in this kind of debacle allow, in their credulity or indolence, commercial agents to commandeer their reputation and do a tremendous disservice to their readers. The boating media needs to do a better job of maintaining impartiality.
While blemished, the picture is not universally bleak. The tests below manage to present credible data. For example: the West Marine testing, a product of the world’s largest marine retailer’s desire to test the anchors it distributes. Although obviously commercial, the testers at least uphold the appearance of brand-neutrality, and indeed their bestselling anchors (at the time) are those with the poorest results. A radically different example is John Knox’s work in Practical Boat Owner, a continuation of a long-time obsession with anchors – much more a labor of love than any mercenary effort by the magazine writer who fancies himself a research scientist for the day.
These tests are therefore overviewed here with an eye to their scientific credibility, a standard which leads to the rejection of a number of published articles. Tests are also restricted to those which include the Rocna or Vulcan, but have no connections to any anchor manufacturer.
Kippari March 2015
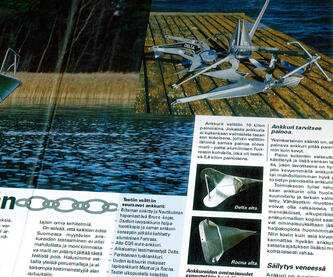
The Finns at Kippari (Skipper) conducted a small and simple comparison test on dry land, using an industrial sand and gravel pit. The substrate appeared consistent from location to location, which many other poorly controlled tests cannot match, although unfortunately it does not appear to have been realistically wet. Nevertheless the data for hard sand, where many contenders simply failed to set, is worthwhile, and in soft sand interesting differences are found too.
“The test’s top anchor for absolute grip and holding power” was the Rocna, although the magazine included Finnish retail pricing in their final consideration and slipped the New Zealand design down a spot as a consequence. They also considered dimensions and physical bulk of the anchors, with regard to bow roller fit. Only the pull data is reproduced here.
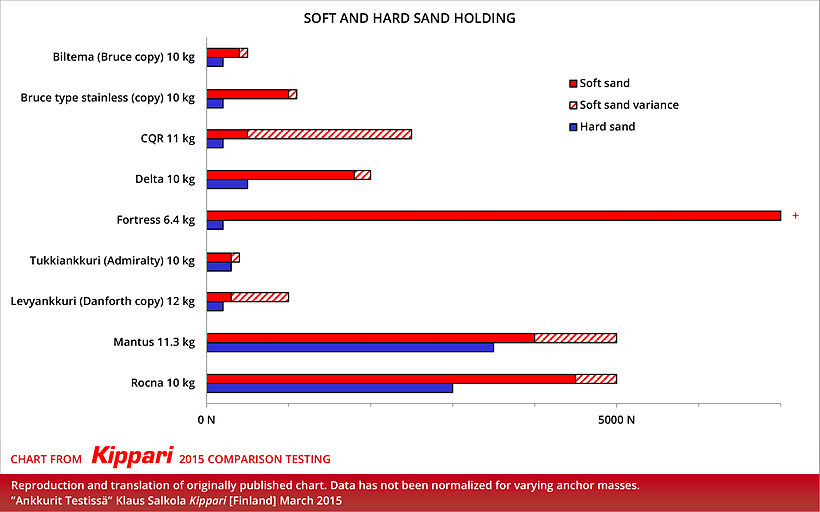
The results were not adjusted for the variance in mass between the anchor models tested, an irritating omission given there is a 20% variance between the lightest (10 kg) and the heaviest (12 kg) steel products, and a 47% variance if the aluminium Fortress is considered. The inclusion of the latter is always a problem for tests; the FX‑23 model chosen by Kippari is relatively large, and would weigh nearly 18 kg were the same design built from steel. Accordingly, the reader should really try to view the results on a size-for-size basis, especially if an anchor of different size to those tested here is required.
Voile Magazine May 2012
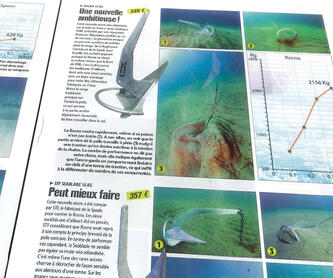
French magazine Voile has accrued a number of anchor tests to its name. Historically French products have been the focus, at the expense of other anchor types more common in the rest of the world. In this iteration the Rocna and a few other international brands were added to the list of contenders, which were tested on a “loose and loamy sand” seabed. The assistance of the French SNSM (analogous to the British RNLI) was employed, and it was one of their boats tasked with the pull testing.
Voile selected a total of fourteen anchors, and in their write-up and analysis of results separated them into three groups: “plate” anchors (symmetrical flat fluke types), “light” anchors (aluminium), and “plow” anchors (asymmetrical types). This last misnomer – less than half of those in the “plow” group were actually plows – may be forgiven as the writers have avoided the apples-to-oranges comparisons of different types and materials seen all too often in other tests. In the other categories, the light aluminium Spade and Fortress turned in good linear pull results but both failed physically (“twisted”) under the stress of the veering test.
This write-up did not include several of the traditional types usually seen, particularly the CQR and Bruce. The CQR was tested but would not reliably set and was excluded from the final results. The genuine Bruce is no longer manufactured but Voile tried to test the “Ray”, a knock off version by Manson, which also would not set and was similarly excluded from the tabulated data.
Test design
This test does suffer from an unfortunate tendency amongst magazines to measure loads whilst dragging the anchors, the testers apparently apathetic toward the notion that the primary function of an anchor is instead to stay where it was set. John Knox’s article in Practical Boat Owner (overviewed below) is an excellent counter-example of measuring the right properties in the right manner, which other publications could benefit from following.
Nevertheless, drag data of this sort is informative because, if the anchor is to drag, it is important that it continues to provide as much resistance as possible whilst doing so. When pulled beyond its yield, a good anchor will remain properly embedded rather than suddenly releasing, and should continue to bury down to where firmer substrate may provide a more secure holding.
Additionally, figures for “skewed holding”, or veered pulls, were measured by Voile to add to their conclusions. This data increases credibility and relevance to the real world where a general purpose anchor must do much more than simply provide good holding power in simple linear pulls.
Overviewed here are only the results for the “plow” group of asymmetrical general purpose anchors.
Results
Voile dragged their anchors at an increasing velocity, measuring resistance at speeds from 0.1 knots to 0.4 knots. The latter was the penultimate speed, supposed to represent a dragging vessel in high winds or tide, and it is the figures for this that are charted in dark red in the graph below.
The results of the veered pulls are charted in yellow. This data is not normalized or adjusted for the varying sizes of the anchors.
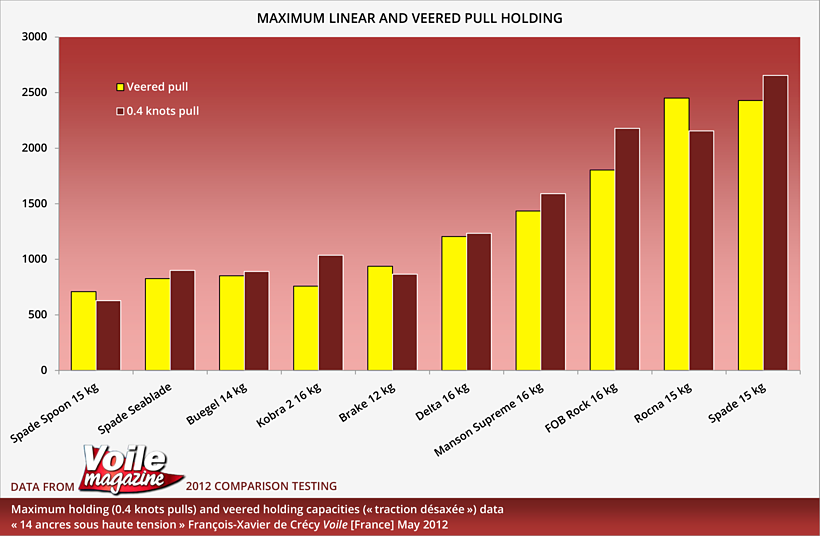
While the “0.4 knots” pull data is not directly representative of the actual static holding power of the anchors, together with the veered pulls these results give a reasonable picture of relative anchor performance.
Practical Boat Owner (John Knox) August 2011
Scotsman Professor John Knox has a history of anchor testing, write-ups of which have appeared in Practical Boat Owner before. Introducing this article, he describes his experience tenuously anchored to a CQR in the Inner Hebrides during a storm in 1988, and how this led to the testing of anchor types in order to best appraise performance.
Knox examined eight different anchor types, with the addition of multiple sizes of a few. He used tidal pools on sand flats on the west coast of Scotland, using a custom rig to exactly control pull forces and speeds.
Test design
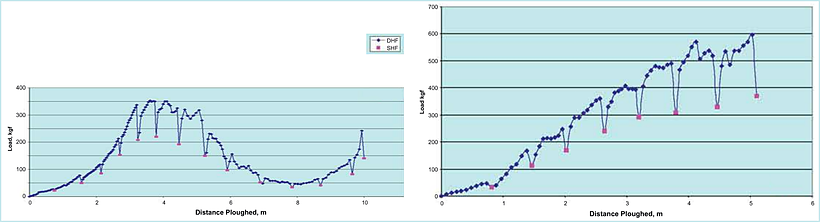
Anchors ranged from small 5 kg (11 lb) to medium 15 kg (33 lb) examples. Unlike the dump-and-pull technique frequently used in other tests, Knox used a carefully designed rig powered by a winch and purchase system with a slightly elastic line. The anchors were pulled with intermittent pauses, allowing the candidate to rest and settle according to the pull maintained by the elasticity of the “rode”. This provided a figure for what Knox labels SHF (“Static Holding Force”). This process was repeated until the figures for SHF had leveled off and were judged unlikely to increase with further pulling – this final plateau dictated the anchor’s recorded holding power.
This methodology provides graphs of the anchor’s intermittently recorded SHF figures over time during each set, the shapes of which are also of direct interest. A poor design will give fluctuating and unstable SHF numbers – or an anchor that sets poorly and with shallow depth will quickly hit its plateau, while a good performer will show a steady rise stabilizing only at a relatively high force level.
Results
Knox seems well aware of the various pitfalls of anchor testing, and has avoided many of them in this test. His pull figures were firstly normalized against the results for a particular anchor for each session, to account for variations specific to that day or seabed area. Consolidated results were then further analyzed on a weight-for-weight basis and presented as “efficiency” values. The smaller anchors of each type, where multiple weights were tested, were found to be less efficient that the larger versions; nonetheless the results are presented without further analysis.
The below chart shows both normalized holding power and the rated efficiency values.
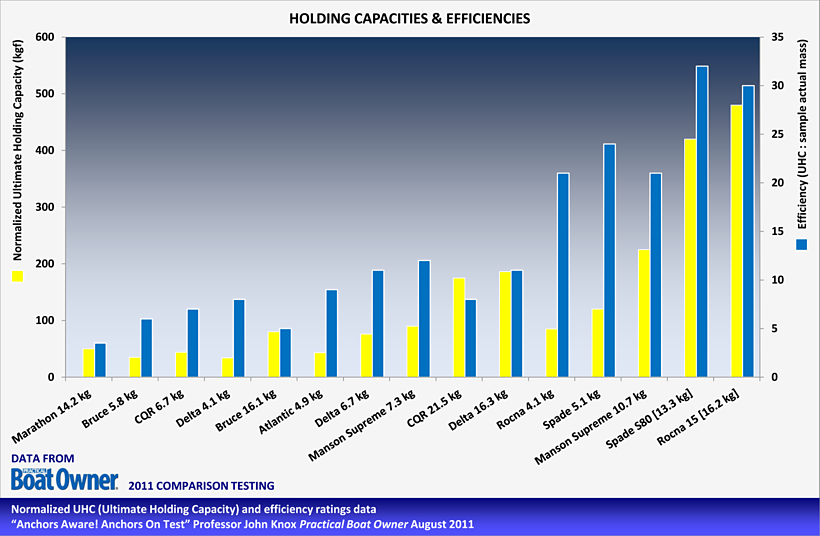
This weight-for-weight efficiency measure is a fair approach in principle but does favor anchors with reduced strength (thinner section profiles and the like resulting in lower weights for a larger fluke surface area). It also fails to account for manufacturing tolerances outputting a lighter or heavier sample for what is really the same nominal ‘size’. For example, the Rocna 15 tested is nominally 15 kg but measured by Knox at a conservative 16.2 kg, while its Spade S80 competitor with an equal listed mass was found to shortchange its owner at only 13.3 kg. These variances combine to favor the undersized anchor in results – unduly so, because while tolerances or wear of material on a used anchor may cause significant variation, the surface area of the fluke, which dictates performance, is not affected by these factors.
The below chart depicts the same data as above, but with the efficiency values re-calculated based on nominal sizes.
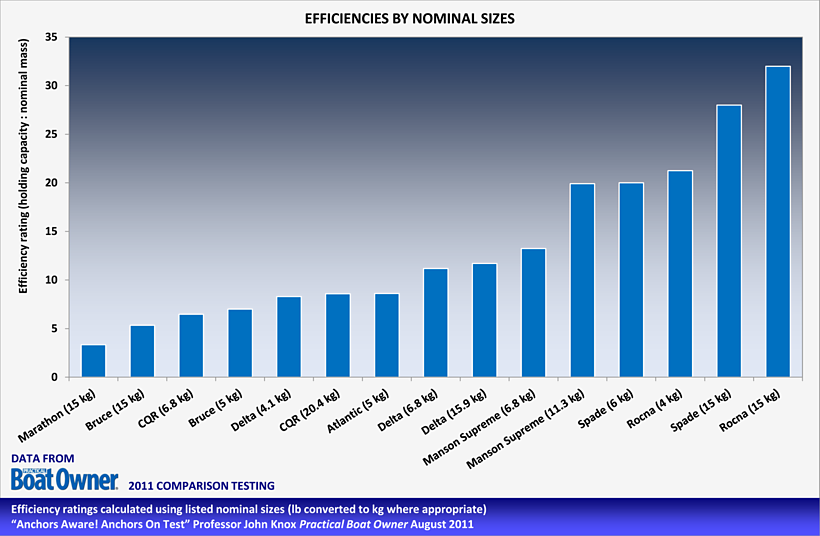
Larger anchors may expect to gain higher efficiency ratings, and this is borne out in this test when two sizes of the same type are compared. This is most obvious in the small sizes selected; by simple virtue of size, 15 kg anchors may expect their fluke tips to find better quality substrates than their 4 or 6 kg little brothers which have to make do with only the very top layer of the seabed. More telling is when a smaller anchor is proven to be substantially more efficient than its larger competitor.
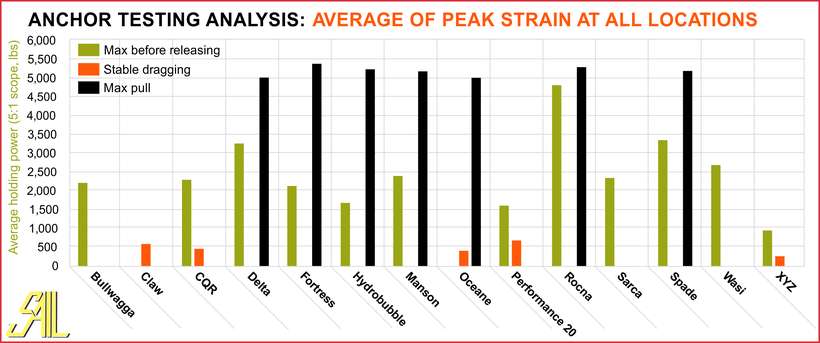
West Marine, SAIL, & Yachting Monthly 2006
The big American retail chain has conducted a number of anchor tests over the years, and 2006 saw it put together a series of trials on three different sand seabeds with no less than fourteen different anchor types. They used real world locations and a realistic rode make-up.
Brief summaries of the results were included in the 2007 and 2008 West Marine catalogs. Additionally, staff from magazines SAIL and Yachting Monthly were present and proceeded to publish their own write-ups of the testing. These write-ups were problematic with confused analyses of the data and outright contradiction of one another on a number of details, but SAIL provided a good overview of the results in a chart averaging holding power and peak resistance.
Test design
Anchors of approximately 15 kg (35 lb) were selected, mostly steel but unfortunately including a few with part or whole aluminium construction. The aluminium Fortress FX‑37 Danforth-type chosen is relatively large compared to the other anchors tested, a size that would weigh in at over 25 kg (55 lb) if its aluminium was swapped to steel. Aluminium is weaker than steel, especially when compared to high strength grades: no less than two Fortresses were damaged and put out of action during this testing.
The testers used a short 20′ (6 m) length of 5/16″ (8 mm) chain, coupled to 1″ (25 mm) nylon to make up the rest of the rode. Tests were conducted at scopes of 7:1, 5:1, and 3:1, by a suitably large motorboat permitted to run up a maximum force of 5,000 lb-force (2,270 kgf). Consistency and reliability of the contending anchors was measured by further varying the testing to cover three different locations with different variations on a theme of hard sand.
The ability of the anchors to deal with a variety of tough (hard to penetrate) bottoms was well examined in this test, and the results serve to show up magazine “tests” which do not conduct repeat trials. Some anchors gave high peak results during some trials, but let themselves down during others. Consistency is a critical element of any anchor’s performance.
This table contains the summary comments published by West Marine themselves. Charted data results are below.
| Company | Anchor | Material | Weight (lb) | West Marine comments, complete and verbatim |
|---|---|---|---|---|
| Noteco | Bulwagga 27 | Steel | 28.6 | Held up to 3,000lb., engaged each attempt. Released and failed to reset at higher loads. |
| Lewmar | Claw 33 | Steel | 36.3 | Failed to set during this test. Maximum tension under 700lb., briefly. |
| Lewmar | CQR 35 | Steel | 38.5 | One promising set to 2,000lb., but little else. Would not engage bottom. |
| Lewmar | Delta 35 | Steel | 36 | Variable results ranging from around 1,500lb. to 4,500lb. Drags at limit. |
| NavX Corp | Fortress FX‑37 | Aluminium | 21.9 | Generally held as much tension as we could throw at it. Was slightly damaged when pulled over 5,000lb. Excellent performance. |
| Anchor Concepts | Hydrobubble 45 SA | Aluminium + stainless steel | 16 | Surprise performer based on small size and weight. Held over 5,000lb. twice, also held to 1,600lb twice and released. |
| Manson Marine | Manson Supreme 35 | Stainless steel | 35.9 | In six pulls never held less than 2,300lb, and held over 5,000lb three times. Seemed to engage the bottom immediately. |
| SPADE | Océane 35 | Steel | 38.2 | Highly variable results. After four disappointing results, the Océane held over 5,000lb on the last two pulls. Puzzling. |
| Rocna Anchors | Rocna 15 | Steel | 32 | Superb, consistent performance. Held a minimum of 4,500lb and engaged immediately. |
| Anchor Right | SARCA #5 | Steel | 33 | Medium performer that held in the 2,000lb range and either released or dragged. One pull to 5,000lb. |
| SPADE | Spade S80 | Steel + lead | 34.4 | Somewhat mixed results with three OK pulls, and three maximum pulls. Set immediately each time. |
| WASI | WASI 35 SS | Stainless steel | 32 | Varied results from 1,300lb to maximum tension. Failure mode was generally dragging. |
| West Marine | West Marine Performance 20 | Steel | 26.3 | Disappointing results considering previous tests. Held 200 to 1,500lb, but could not get a secure grip. |
| XYZ Marine | XYZ | Stainless steel | 10.6 | Could not get anchor to work. One pull at 900lb, but mostly dragged on the bottom. |
Averaged results
SAIL published the below chart, which graphs three different metrics if applicable for each anchor. “Max before releasing” is the only figure presented for all (except two anchors which failed to set): this is the most important, averaged “holding power” or static resistance. “Max pull” is the peak resistance measured by the testers, either static (holding) or dynamic (dragging) – this figure should be higher than “Max before releasing”, as a good anchor will give increasing resistance as it is dragged beyond yield. The absence of this figure, where it was lower than the static holding power, does not tell a pleasant tale for that type.
References
- “Holding Power” Bill Springer, SAIL October 2006
- “Ultimate Holding Power” Toby Hodges and Bill Springer, Yachting Monthly December 2006
- “Anchor and Docking / The West Advisor”, West Marine Annual Catalog 2007–2008
- “Anchors Aware! Anchors On Test” Professor John Knox Practical Boat Owner August 2011
- « 14 ancres sous haute tension » François-Xavier de Crécy, Voile Magazine May 2012
- ”Ankkurit Testissä” Klaus Salkola Kippari March 2015